Cambridge Digital Mining Industry Report (June 2025)
Executive Summary*
The 2025 Cambridge Digital Mining Industry Report (survey coverage ≈ 48 % of total Bitcoin network hash‑rate) shows that Bitcoin mining has matured into a capital‑intensive, energy‑centric data‑centre business. Rapid ASIC efficiency gains, strong institutional capital inflows and a progressively greener power mix now define the sector.
- Scale & Growth – Cumulative power consumption reached 138 TWh in 2024 (TWh = terawatt‑hours). Energy per unit of work fell 24 % to 28.2 J/TH (J/TH = joules per tera‑hash, a standard efficiency metric).
- Decarbonisation – Sustainable energy (renewable + nuclear) already supplies 52.4 % of mining load; annual greenhouse‑gas footprint is 39.8 Mt CO₂e (CO₂e = carbon‑dioxide equivalent), only ~0.08 % of global emissions.
- Institutional Capital – Net assets in U.S. spot‑Bitcoin exchange‑traded funds (ETFs) rose from 0.62 million BTC to 1.11 million BTC in 2024. Assets under management (AUM) now stand at ~US $104 billion.
- Geographic Shift – The United States hosts ~75 % of survey‑reported hash‑power (hash‑rate is measured in EH/s = exa‑hashes per second). Paraguay, UAE, Norway and Bhutan have emerged as secondary hubs.
- Cost & Margin – Median delivered electricity cost is US $45 /MWh (MWh = megawatt‑hour). Including all other operating expenses (OPEX) yields an all‑in average of US $55.5 /MWh. Elevated Bitcoin prices in Q4‑24 pushed industry “hash‑margin” (revenue minus direct power cost) to record highs.
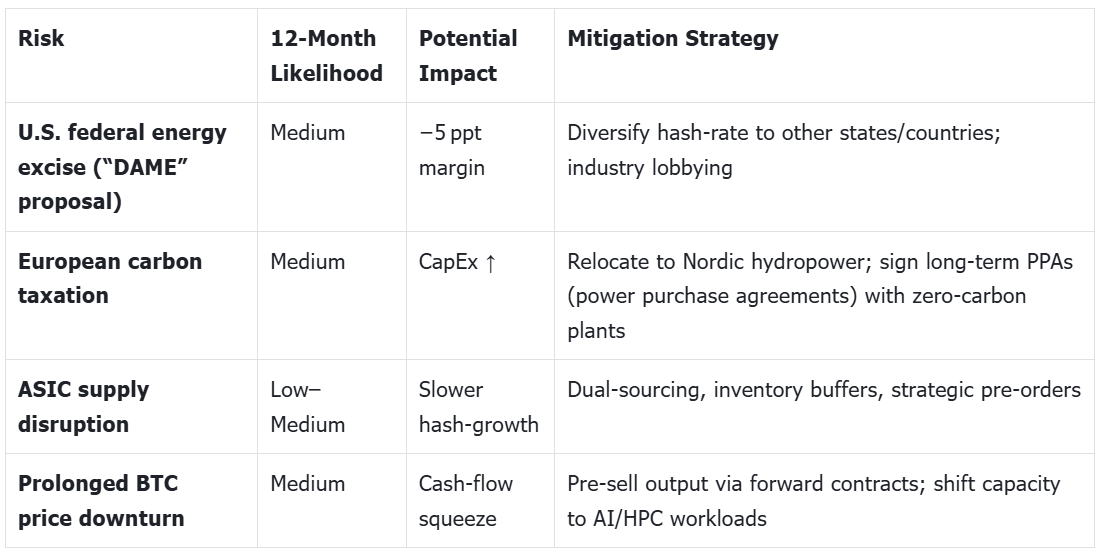
- Risk Dashboard – Core concerns remain: (i) rising energy prices, (ii) policy uncertainty, (iii) ASIC supply concentration (Bitmain, MicroBT, Canaan > 99 % market share). Common mitigants include long‑term power hedging, geographic diversification and vertical energy ownership.
Strategic takeaway: Improvements in energy efficiency, emerging grid‑service revenues and sustained institutional demand are offsetting the April 2024 block‑reward halving. Operators must nevertheless focus on power‑cost control, transparent ESG reporting and revenue diversification (AI/HPC hosting, flare‑gas utilisation) to protect margins into the next halving (2028).
Industry Fundamentals
Network Security & Economics
- Halving 2024: The programmed reduction of block subsidy from 6.25 → 3.125 BTC per block. While transaction‑fee income averaged only 6 % of miner revenue, short‑term congestion (e.g., “Ordinals” inscriptions) proved fees can exceed 100 % of subsidy at peak load.
- Security Budget: Despite a 50 % reward cut, global hash‑rate climbed to 796 EH/s by year‑end, validating miners’ incentive to reinvest capital.
- ASIC Roadmap: Latest 5‑nanometre and 3‑nanometre chip designs (Bitmain S21, MicroBT M66) deliver < 20 J/TH. Prototypes under 10 J/TH are planned for 2025–26, implying another 2× efficiency gain.
Capital Structure & Public Listings
Roughly 41 % of global hash‑rate is controlled by publicly‑traded miners, enabling mixed debt‑and‑equity capital structures. Post‑2023 deleveraging left most majors below 0.5× net‑debt‑to‑EBITDA (earnings before interest, tax, depreciation and amortisation).
Environmental & ESG Performance
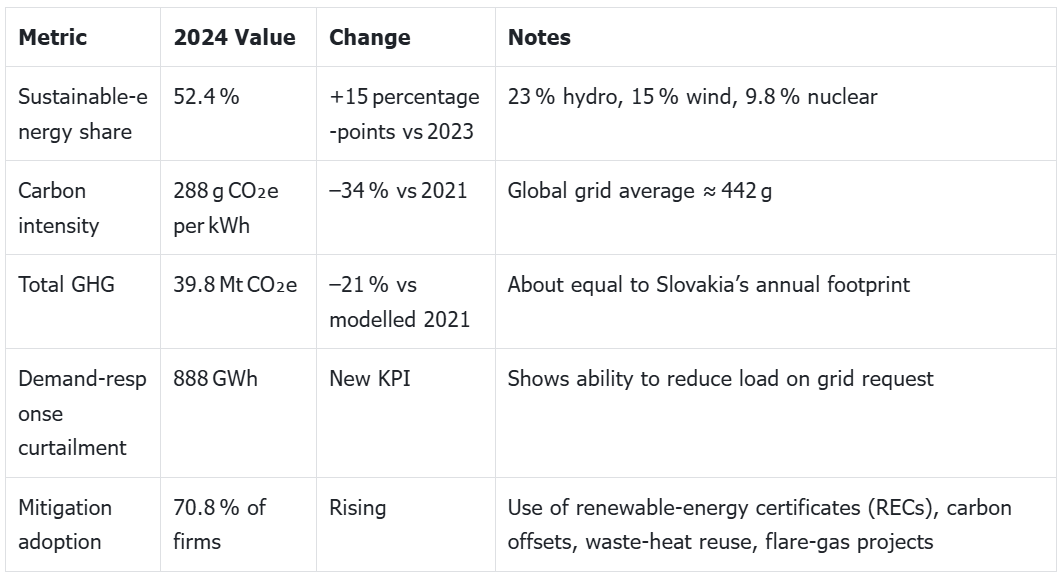
ESG outlook: Continued U.S. grid decarbonisation, flare‑gas monetisation in North America & Middle East, and Nordic expansion could lower sector‑wide carbon intensity below 200 g CO₂e/kWh by 2027. Debt markets already price a 50–150 bp (basis‑point) advantage for miners sourcing > 50 % low‑carbon power.
Operating Cost Curve – How to Read It
- Power‑cost quartiles (¢/kWh)
- Q1 ≤ 3.2 ¢ – lowest‑cost 25 %: direct hydro, wind, on‑site flare‑gas, or self‑owned generation; remain profitable in almost any market.
- Q2 3.2–4.5 ¢ – long‑term power purchase agreements (PPAs) in North America or Scandinavia; still low‑cost but require modern ASICs.
- Q3 4.5–6.0 ¢ – industrial tariffs or grid power with modest discounts; margins compress quickly after halvings or price dips.
- Q4 > 6 ¢ – highest‑cost 25 %: retail grid power; first to curtail during bear markets.
- ASIC‑efficiency quartiles (J/TH)
- Q1 ≤ 25 J/TH – latest‑gen chips, often immersion‑cooled.
- Q2 25–30 J/TH – 2023‑era units (e.g., S19 XP, WhatsMiner M60).
- Q3 30–40 J/TH – 2021‑22 hardware; viable only with ≤ 4 ¢/kWh power.
- Q4 > 40 J/TH – legacy rigs (e.g., S17/T17); profitable only below 3 ¢/kWh.
Combined interpretation: The cost to mine 1 BTC ranges US $14 k–36 k. Bottom‑quartile operators (low power cost + high efficiency) can “mine‑and‑hold” during downturns and monetise grid‑balancing services; top‑quartile firms are forced to shut off first in any price slump.
Risk & Regulatory Landscape
Key terms
- PPA (Power Purchase Agreement): A long‑term contract to buy electricity at a fixed price directly from a generator, often renewable. Provides price stability and green‑energy provenance.
- FERC: Federal Energy Regulatory Commission (USA); governs interstate electricity markets. Its ruling on “flexible‑load remuneration” could set nationwide payments to miners for grid services.
Strategic Growth Themes
- AI / HPC Convergence – Repurpose or co‑locate mining facilities (high‑density power, immersion cooling) for GPU‑based artificial‑intelligence training jobs. Potential revenue: US $1.0–1.5 per kWh vs Bitcoin mining ~US $0.35.
- Vertical Energy Integration – Joint ventures with natural‑gas producers (on‑site generators) or renewable developers. Goal: achieve < 3 ¢/kWh all‑in power and create additional revenue by selling surplus electricity to the grid.
- Green‑Bitcoin Premium – Certification schemes (e.g., Sustainable BTC Council) aim to sell “provably green” coins at a 1–3 % price premium; early adopters gain reputational and funding advantages.
Valuation & Monitoring
- EV/EBITDA 2025E among leading North‑American miners: 4.8×–6.2×. Low multiples reflect residual policy risk and uncertainty about long‑term transaction‑fee capture.
- Price‑per‑petahash (P/PH): US $45–70 million. Lower P/PH indicates cheaper entry to hashrate growth but may imply higher operating cost.
Catalysts to watch (next 12 months)
- ETF net‑inflows > 100 k BTC in H2‑25 – bullish for price and miner revenue.
- 16 J/TH ASIC mass shipments – advantage low‑cost miners, pressure legacy fleets.
- U.S. FERC decision on flexible‑load payments – could formalise grid‑service income.
- EU MiCA sustainability rules finalised – greater reporting burden but policy certainty.
Investment Conclusions
- Overweight vertically‑integrated miners with < US $0.05 /kWh power, < 25 J/TH fleets and > 50 % renewable energy.
- Neutral / Accumulate hosting‑only or single‑jurisdiction operators once clarity emerges on U.S. taxation and EU carbon disclosure.
- Underweight / Avoid high‑leverage miners dependent on > US $0.07 /kWh grids or > 40 J/TH equipment; their margins will compress sharply when the next generation of ASICs arrives.
Reference
*Cambridge Digital Mining Industry Report (June2025)
Disclaimer: This article does not constitute investment advice. For reproduction or reprint requests, please contact hello@xbank-labs.com